Summary statistics - LAU 2020, population grid 2018, NUTS 2016
How many LAUs were calculated based on the population grid and how many on centroids in each country?
In a small number of cases, it has not been possible to calculate the population-weighted centre, apparently because the relevant municipality did not include any resident according to the population grid (in many albeit not all instances, indeed, a grand total of zero residents is officially registered in a given LAU).
| country | total | pop_weighted | pop_weighted_share |
|---|---|---|---|
| AL | 61 | 61 | 100% |
| AT | 2095 | 2095 | 100% |
| BE | 581 | 581 | 100% |
| BG | 265 | 265 | 100% |
| CH | 2256 | 2255 | 100% |
| CY | 615 | 415 | 67% |
| CZ | 6258 | 6258 | 100% |
| DE | 11007 | 10993 | 100% |
| DK | 99 | 99 | 100% |
| EE | 79 | 79 | 100% |
| EL | 6135 | 6134 | 100% |
| ES | 8131 | 8130 | 100% |
| FI | 310 | 310 | 100% |
| FR | 34968 | 34832 | 100% |
| HR | 556 | 556 | 100% |
| HU | 3155 | 3155 | 100% |
| IE | 166 | 166 | 100% |
| IS | 72 | 65 | 90% |
| IT | 7914 | 7914 | 100% |
| LI | 11 | 11 | 100% |
| LT | 60 | 60 | 100% |
| LU | 102 | 102 | 100% |
| LV | 119 | 119 | 100% |
| MK | 80 | 80 | 100% |
| MT | 68 | 68 | 100% |
| NL | 355 | 355 | 100% |
| NO | 356 | 356 | 100% |
| PL | 2477 | 2477 | 100% |
| PT | 3092 | 3092 | 100% |
| RO | 3181 | 3181 | 100% |
| RS | 169 | 169 | 100% |
| SE | 290 | 290 | 100% |
| SI | 212 | 212 | 100% |
| SK | 2927 | 2927 | 100% |
| UK | 391 | 387 | 99% |
How many LAU centres fall inside the administrative boundary?
| country | total | intersects | intersects_share |
|---|---|---|---|
| AL | 61 | 61 | 100% |
| AT | 2095 | 2095 | 100% |
| BE | 581 | 581 | 100% |
| BG | 265 | 265 | 100% |
| CH | 2256 | 2256 | 100% |
| CY | 615 | 615 | 100% |
| CZ | 6258 | 6258 | 100% |
| DE | 11007 | 11006 | 100% |
| DK | 99 | 99 | 100% |
| EE | 79 | 79 | 100% |
| EL | 6135 | 6135 | 100% |
| ES | 8131 | 8130 | 100% |
| FI | 310 | 309 | 100% |
| FR | 34968 | 34965 | 100% |
| HR | 556 | 556 | 100% |
| HU | 3155 | 3155 | 100% |
| IE | 166 | 166 | 100% |
| IS | 72 | 72 | 100% |
| IT | 7914 | 7914 | 100% |
| LI | 11 | 11 | 100% |
| LT | 60 | 60 | 100% |
| LU | 102 | 102 | 100% |
| LV | 119 | 119 | 100% |
| MK | 80 | 80 | 100% |
| MT | 68 | 68 | 100% |
| NL | 355 | 355 | 100% |
| NO | 356 | 353 | 99% |
| PL | 2477 | 2477 | 100% |
| PT | 3092 | 3092 | 100% |
| RO | 3181 | 3181 | 100% |
| RS | 169 | 169 | 100% |
| SE | 290 | 290 | 100% |
| SI | 212 | 212 | 100% |
| SK | 2927 | 2927 | 100% |
| UK | 391 | 391 | 100% |
If they fall outside of boundary, how far are they?
Oddly shaped LAUs, not uncommon in coastal areas or in the mountains, may have their centroids outside of the LAU itself. The approach used to find population-weighted centres highly reduces the chance of this happening, but does not exclude it completely. The centre, however, should always be within a few hundreds meters at most from the boundary itself.
| gisco_id | country | lau_name | population | distance |
|---|---|---|---|---|
| DE_13003000 | DE | Rostock, Hansestadt | 209191 | 80.11613 [m] |
| ES_17140 | ES | Port de la Selva, El | 958 | 42.02332 [m] |
| FI_075 | FI | Hamina / Fredrikshamn | 20111 | 119.68834 [m] |
| FR_33236 | FR | Lège-Cap-Ferret | 8409 | 14.14551 [m] |
| FR_97603 | FR | Bandrele | 10282 | 114.75343 [m] |
| FR_97606 | FR | Chirongui | 8920 | 371.71747 [m] |
| NO_1505 | NO | Kristiansund | 24179 | 32.08016 [m] |
| NO_1818 | NO | Herøy (Nordl.) | 1777 | 33.78239 [m] |
| NO_4623 | NO | Samnanger | 2485 | 97.72115 [m] |
Let’s see all of these cases for municipalities at least in part covered by the population grid. As expected, they are edge cases, and the centre is actually meaningful.
Selective checks: a tipology of local administrative units matched with a population grid
There are a few main types of LAUs as far as their matching with a population grid is concerned.
Some of these are not expected to present particular issues with the present method:
- LAU with a small share of the population (or no population at all) in grid cells intersecting the boundary lines with a single major population cluster: we expect these to be least problematic and we assume these to be better than centroids
In some other cases, the difference between this approach and simply using a centroid is likely tiny:
- very small LAU with most or all of its population in grid cells intersecting the boundary lines: in such cases, the population grid won’t probably be of much help, but it also cannot be very wrong. Should a centroid be used in such cases? Not much of a difference either way under most circumstances.
There are cases where it may just be very difficult to get it right, as there may not be a good answer even if the centre was selected by a human on a case by case basis:
- polycentric LAU, where the main clusters of residents are of similar size
- oddly shaped LAU (e.g. C-shaped) with significant number of residents at the extremes
Finally, there are two types of LAU that are likely to be most problematic:
- LAU with a large surface, few residents in the grid cells fully inside the administrative boundary, and most or all residents in cells intersecting the administrative boundary, possibly including residents outside the boundary line. These are the ones most likely to be wrong, and are not so uncommon in mountainous or less populated areas.
- LAU with non contiguous territories and resident population along the boundary line of at least one of them
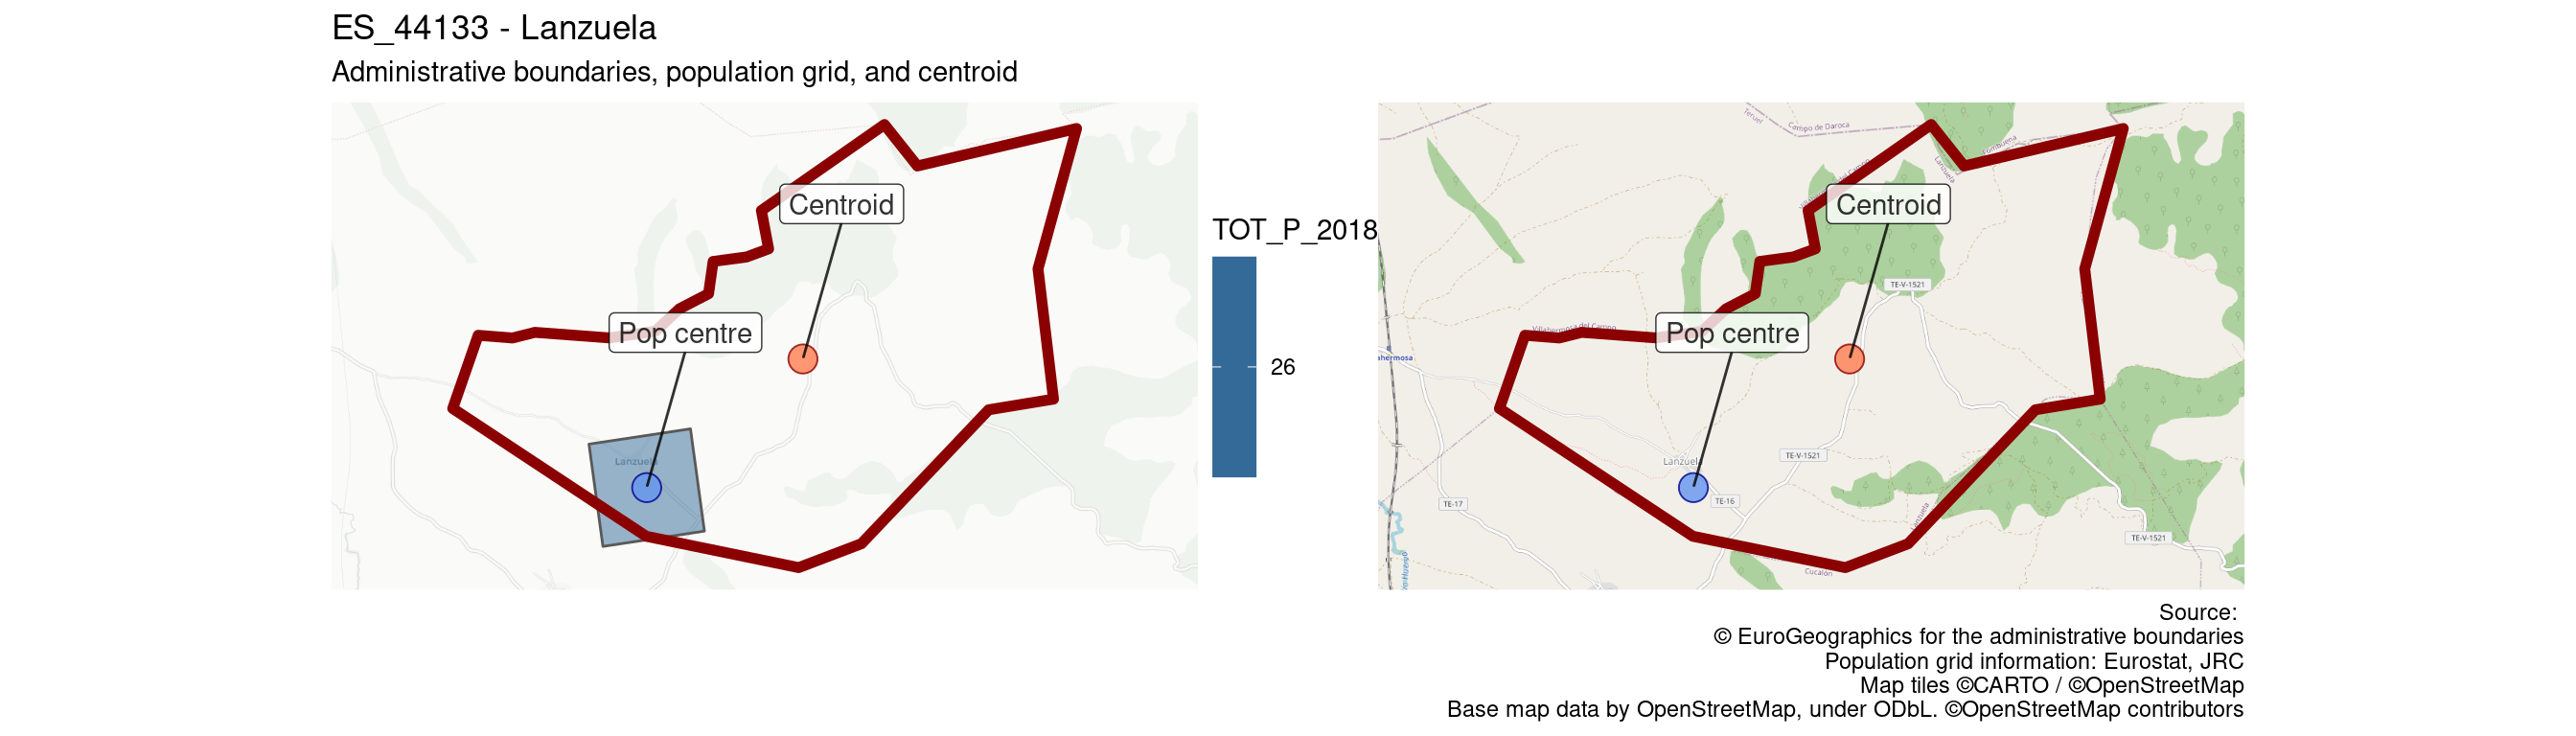
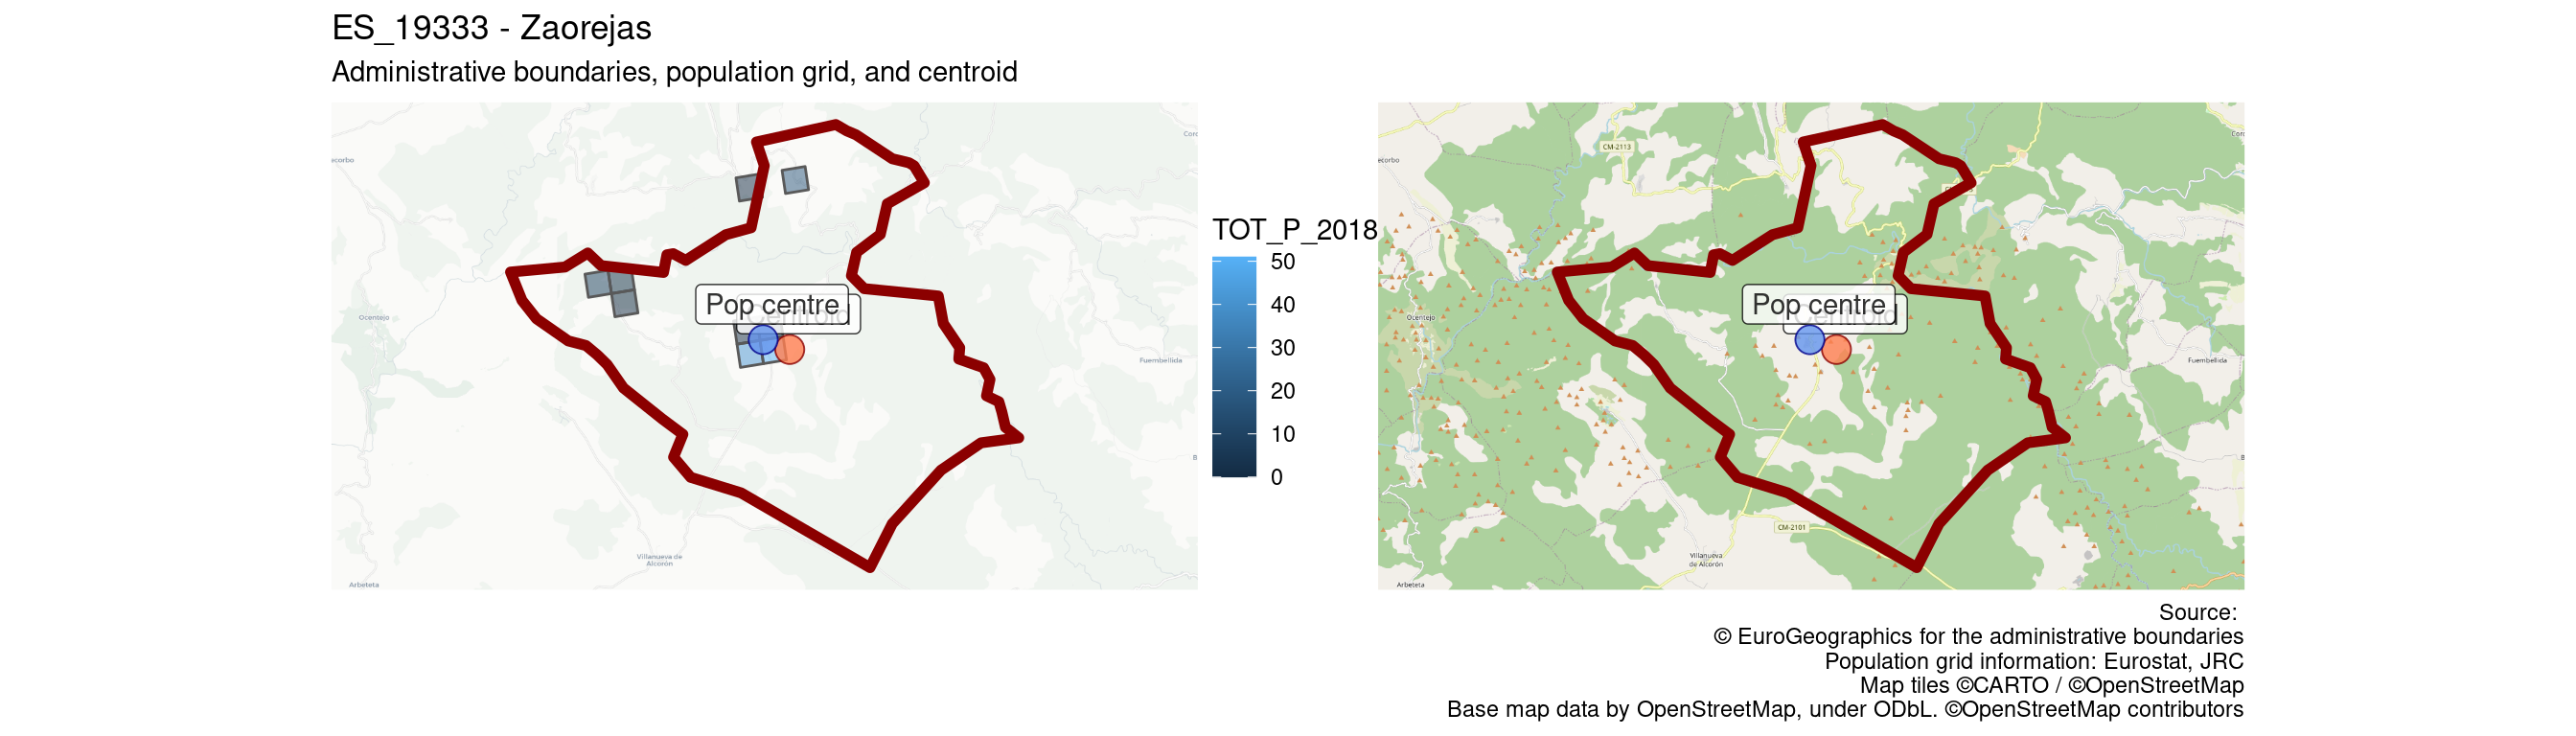
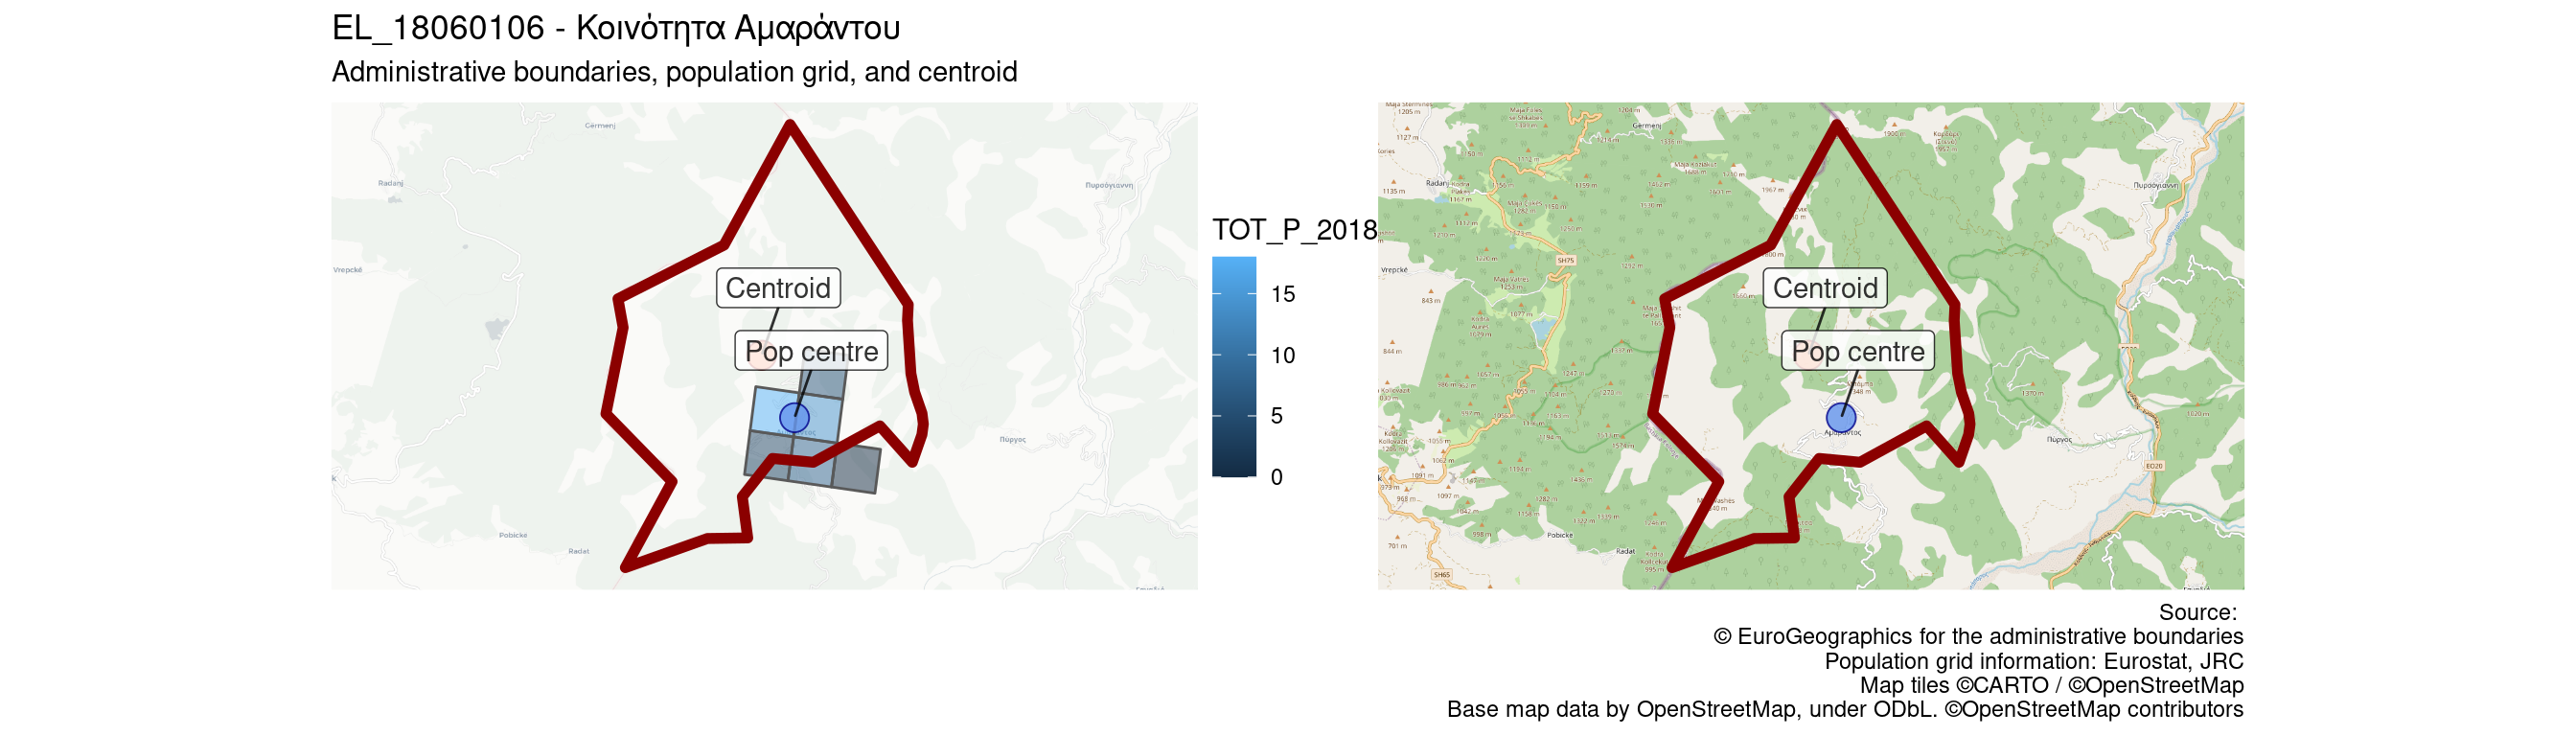
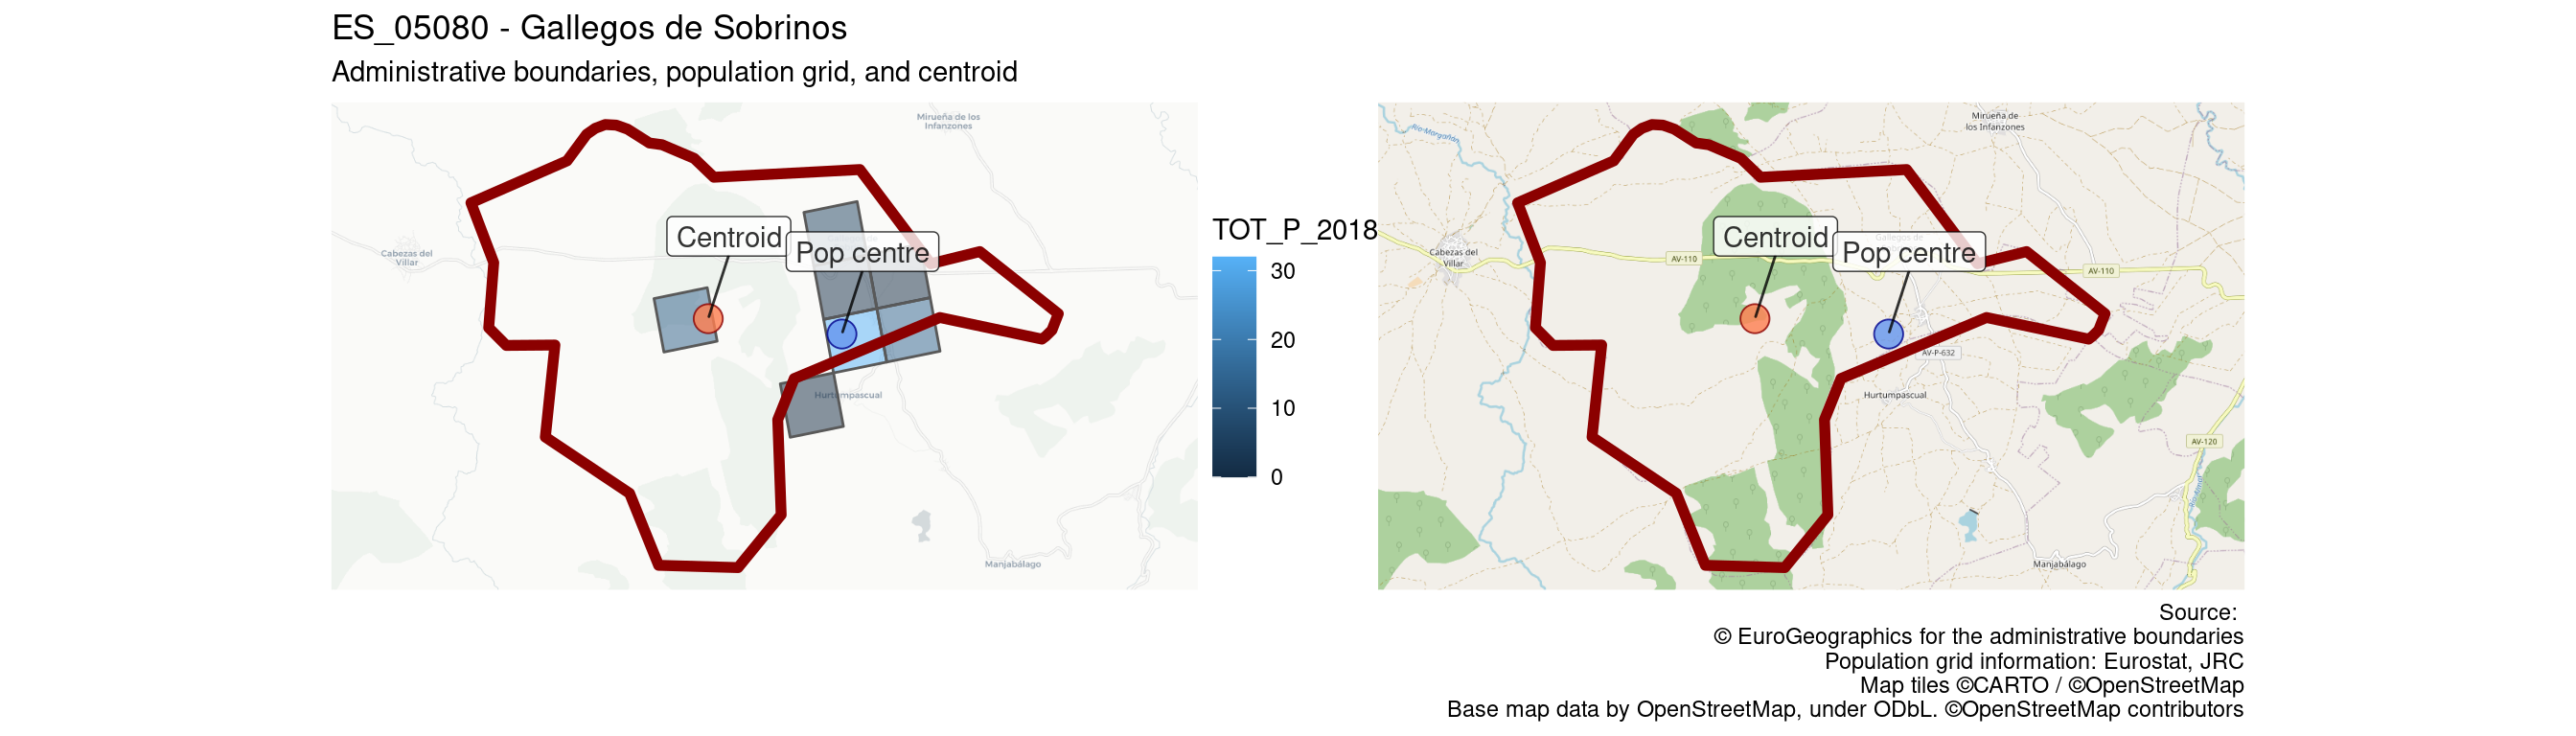
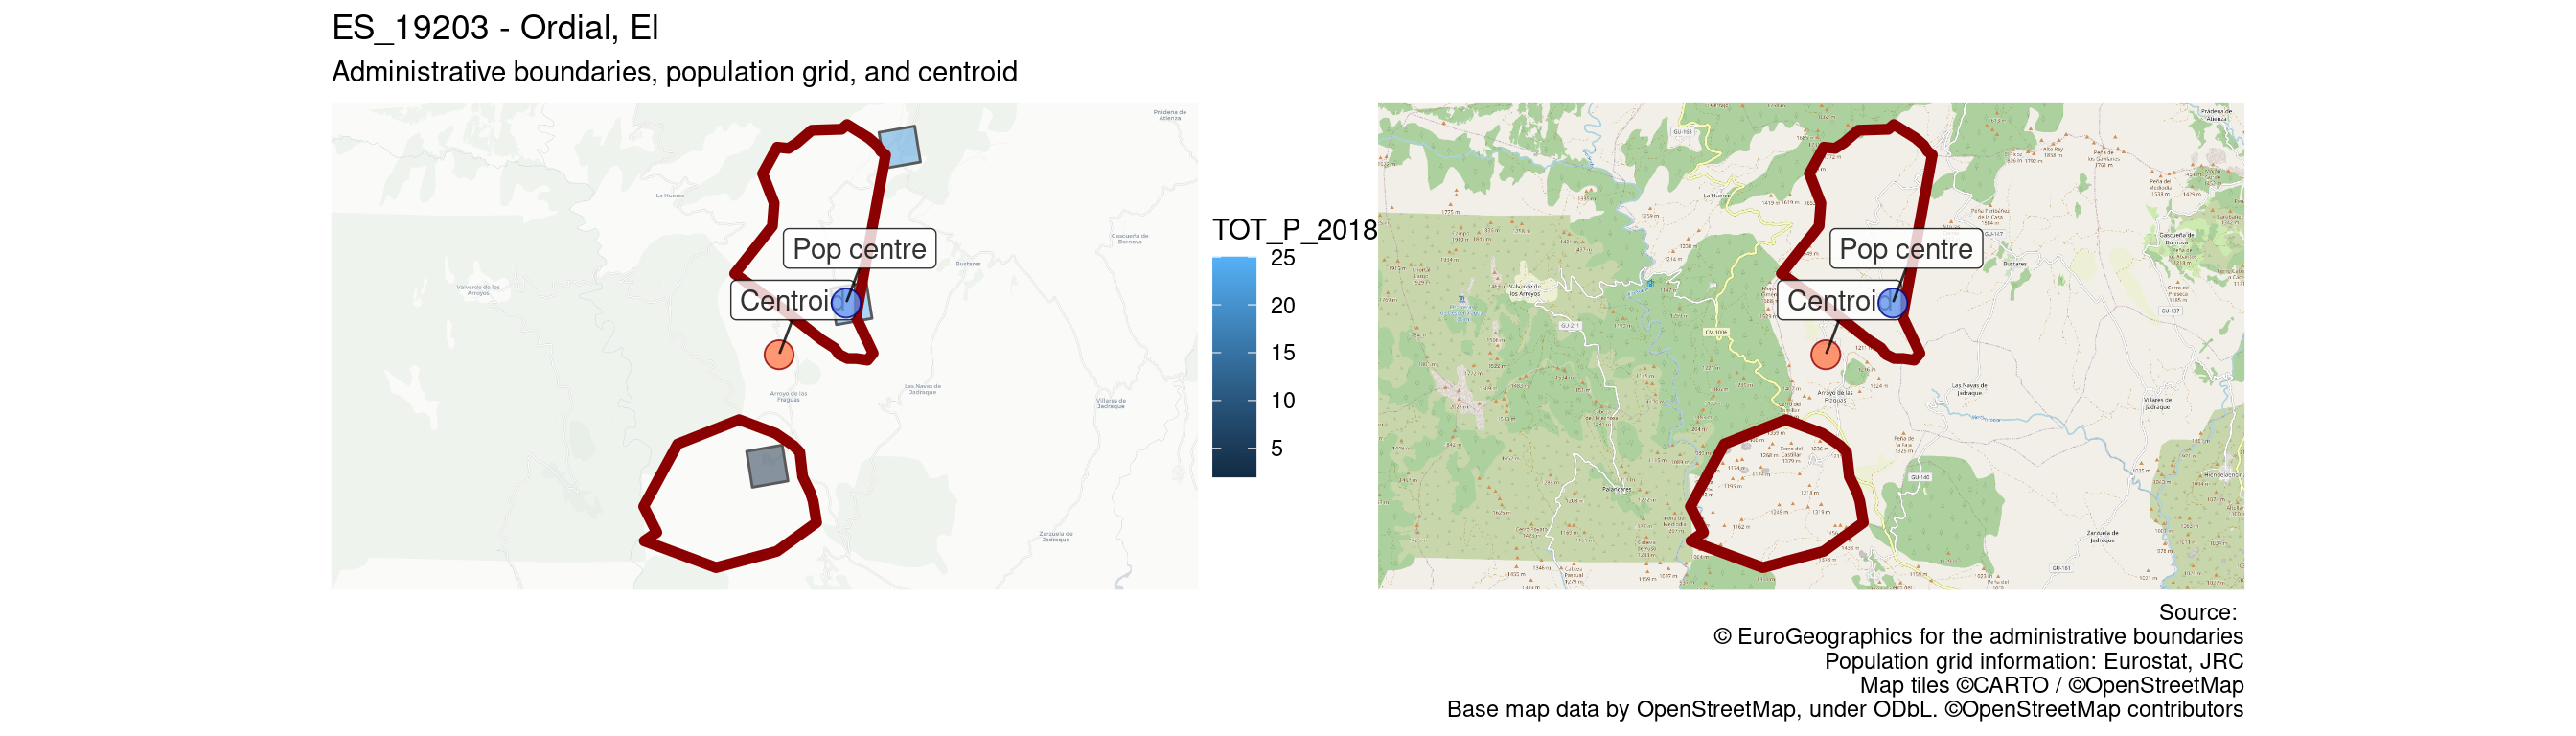
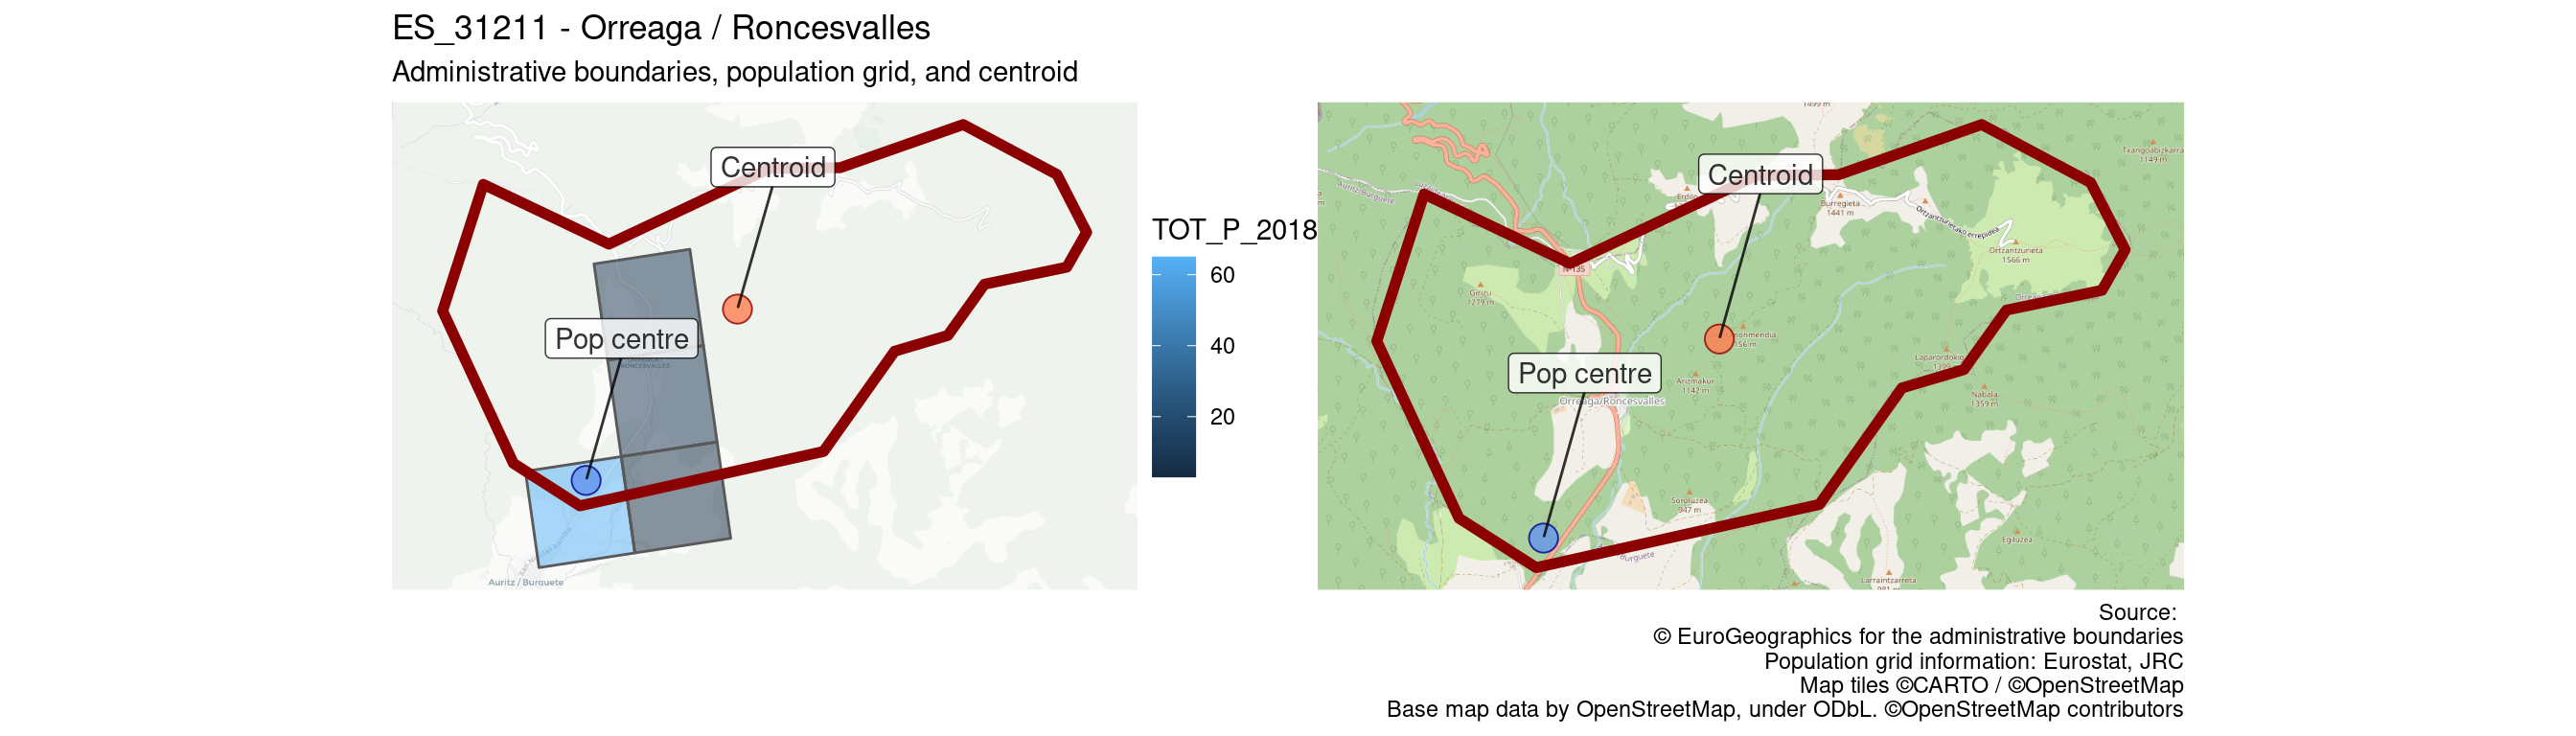
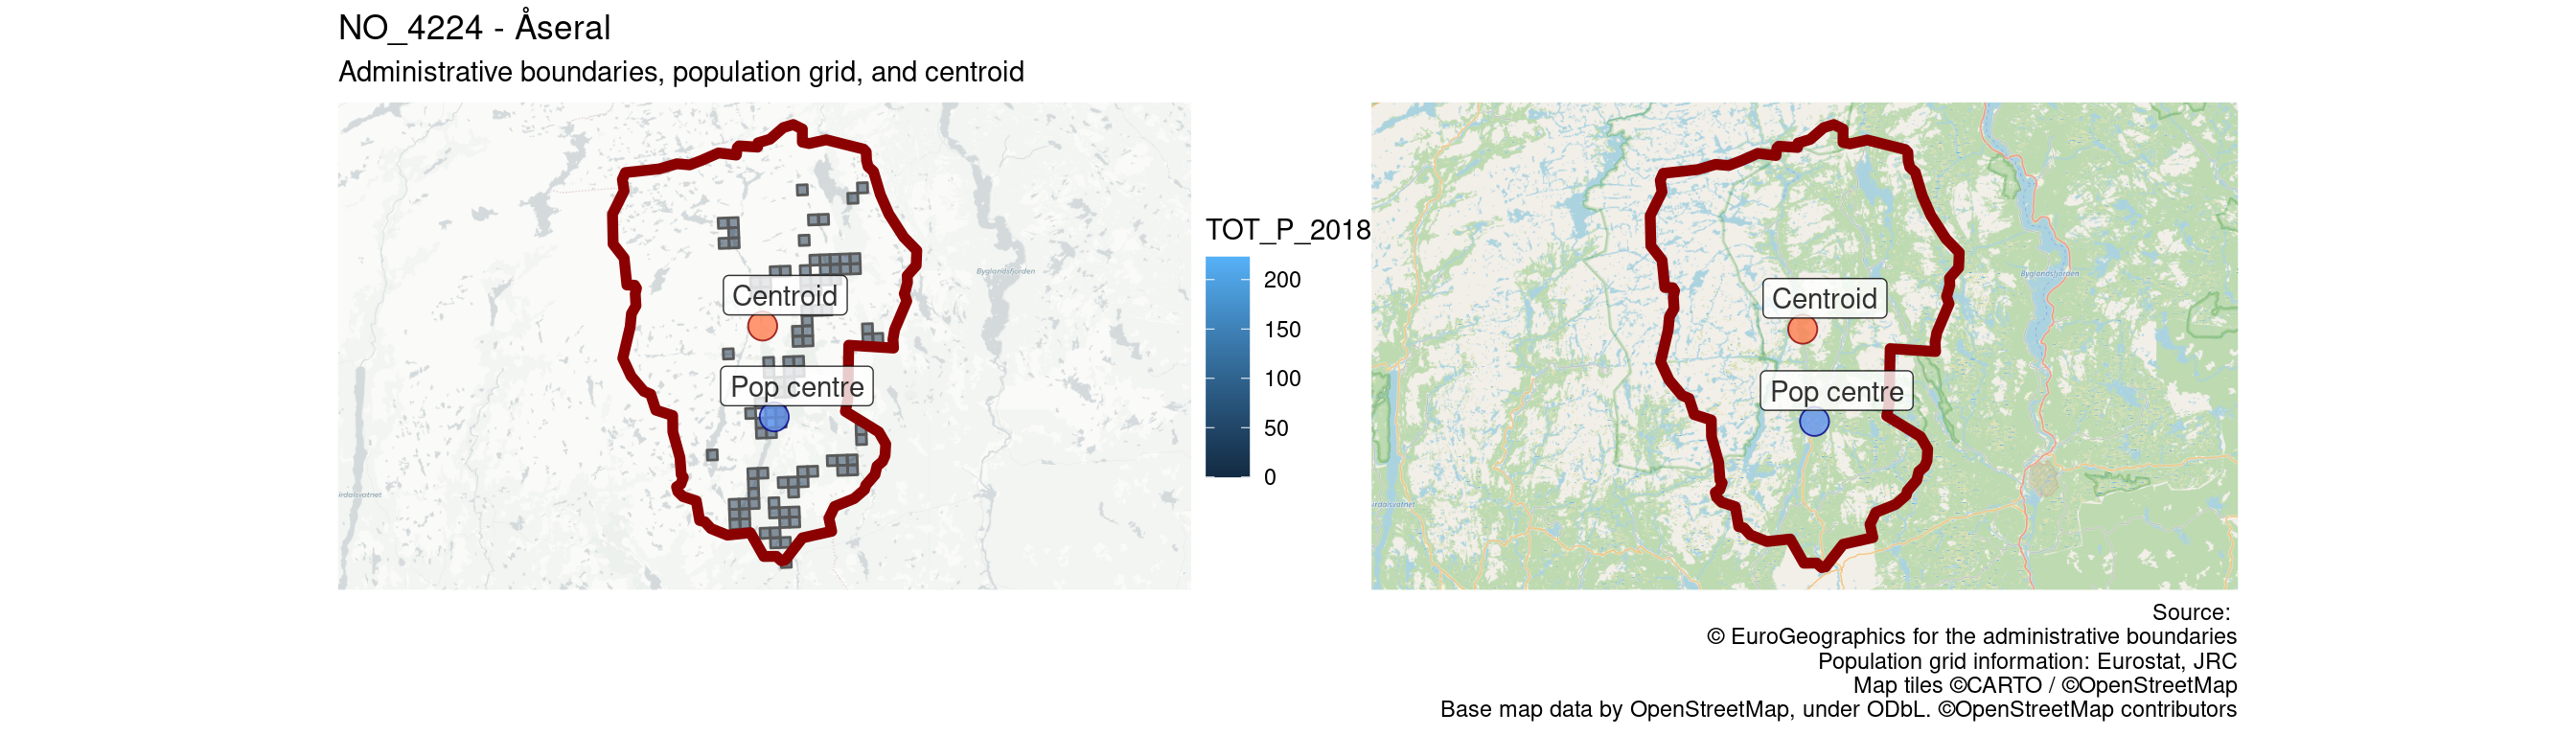
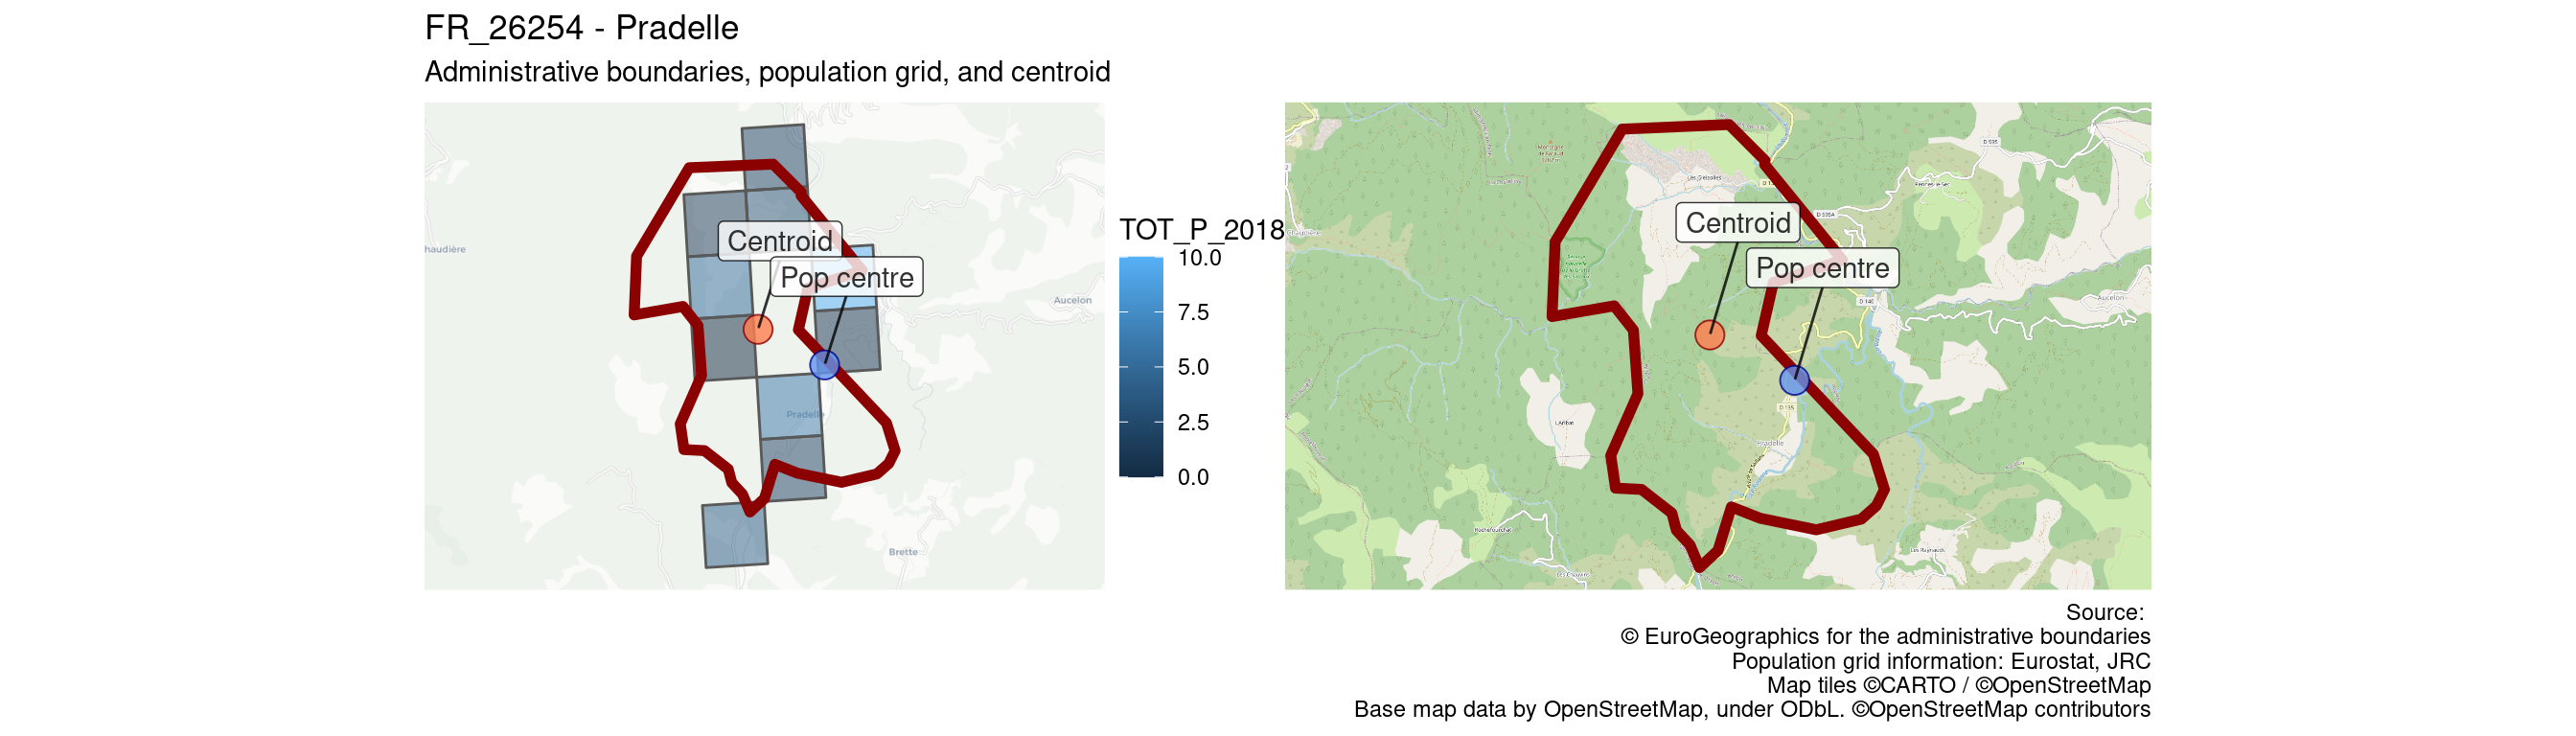
Overall, after manually checking results in hundreds of locations, we expect there to be potentially some issues almost exclusively in LAUs with considerable surface, low population density, and a significant share of that population along the boundary. We provide some random examples below from the relevant subset. Even in such cases, the town centre is mostly meaningful or as meaningful as can be expected in the context.
LAU with considerable surface and low population density
Let’s try to take municipalities with low population density. We’ll take the 1% LAU with lowest population density, remove those who are unlikely to have all residents within 1km of their boundary (at the very least, those with more than 2000 residents).
We’ll then take these 921 municipalities, and check which of them has most residents in grid cells located along the boundary line.
Out of the remaining 507, we’ll take a sample of 10 municipalities and plot them on a map, both showing and not showing the population grid, first using static maps, then using interactive maps for further exploration.
Based on the above considerations, the following should include some of the municipalities that the proposed approach gets most wrong.
Static maps of locations with low population density and significant share of residents located along the boundary


Dynamic maps of locations with low population density and significant share of residents located along the boundary
As the difference is often tiny, and the inhabited locations involved often small, the difference may be better noticeable with interactive maps. The following map includes:
- a purple sign for the centroid
- a blue sign for the population-weighted centre
- a green sign for the population-weighted centre, adjusted to reduce the population of cells that cross the boundary proportionally to the area that falls into the LAU
The difference between the latter two is often tiny, even among these selection of edge cases (low density, relatively large share of residents in cells that cross the bounndary line).